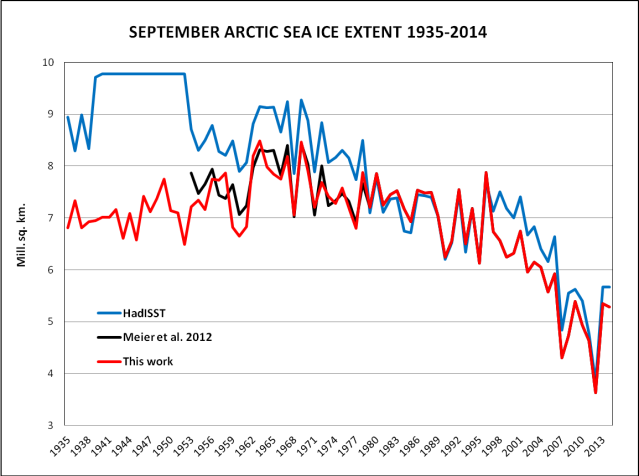
We have just published a new paper in the journal Revista de Climatología (ISSN 1578-8768) . This paper presents a new time series of September Arctic sea ice extent from 1935 to 2014:
– Download extent data values (csv)
– Download gridded data (netcdf)
Abstract
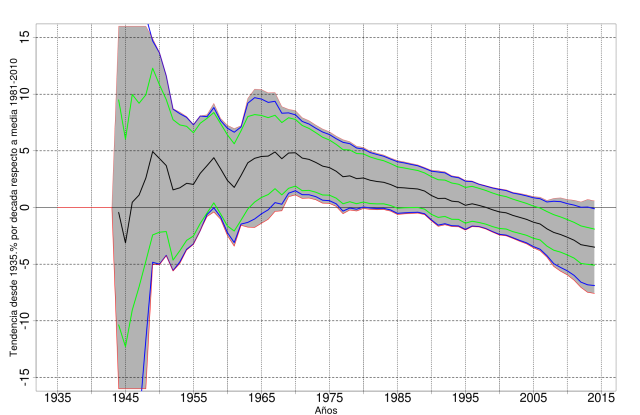
Since 1979 satellite-borne passive microwave sensors have provided a continuous and consistent record of Arctic sea ice extent. This record shows a significant downward trend, particularly at September, when Arctic sea ice reaches its annual minimum. Records before 1979 exist, but are not consistent with the satellite record and have limited reliability, specially before 1953. We present a new time series of September Arctic sea ice extent from 1935 to 2014 that includes data for the Siberian sector (AARI operational charts) not used previously in the Arctic wide existing time series (Walsh, HadISST). The new record has been adjusted to be consistent with satellite data. The trend for 1935-2014 is -3.5% decade, while the trend for the satellite era is -13.3% decade. However, the trends since 1935 until early 1980s are positive and statistically significant. The trends turn negative in the 1990s, reaching statistical significance from 2006 onwards. The lowest annual minimum in the pre-satellite era is higher than any annual minimum after 2001.
Methodology
STEP 1: We adjust HadISST (1953-1978) to match the satellite data, using the same method employed by Meier et al. 2012 . However, we also adjust the gridded data, instead of adjusting only the extent values as Meier et al. did:

Arctic sea ice concentration for September 1960. Left: original HadISST. Right: HadISST after the adjustment to match the satellite data.
—————————————————————————————————-
STEP 2: We incorporate AARI data into previously adjusted HadISST (1953-1978):
———————————————————————————————————
STEP 3: We extend back the time series to 1935, combining AARI data with a climatology (calculated on the basis of the correlation between sea ice extent and temperature):

Left: September climatology for the 1935-1952 period . Right: Arctic sea ice extent for September 1952, after the incorporation of AARI data into the climatology.
Results
September Arctic sea ice extent since 1935 to 2014:
—————————————————————————————————–
September Arctic sea ice extent since 1935 to 2014. Red: this work. Black: Meier et al. Blue: HadISST:

—————————————————————————————————–
Median September Arctic sea ice extent for the lowest decade of the pre-satellite era (1935-1944, left) and for the lowest decade of the satellite era (2005-2014, right):
 ————————————————————————————————
September Arctic sea ice extent since 1935 to 2014. Black: this work. Blue: HadISST. Grey band: estimated sea ice extent using a regression of September SIE on Arctic temperature data (Apr-Sept., 70-90N, CRUTEM4) based on the correlation between sea ice extent and temperature during the satellite era:
 ——————————————————————————————————
The graph below shows the evolution of the trend as years are added to the end of a time series starting in 1935. The first point of the black line shows the trend of a 10-yr time series (1935–1944), and subsequent points extend the time series by one year each up to a trend over the full 80-yr 1935–2014 time series. The green, blue and red lines represent the 99% confidence level according to three different methods (according to the first method, an upward trend is significant when both green lines are above zero, and a downward trend is significant when both green lines are below 0; the same applies to blue and red lines with the other two methods):

(please note that this confidence intervals graph is for the trend, not the confidence in the data itself)
--------------------------------------------------------------------------------
Cea-Pirón, MA and Cano-Pasalodos, JA (2016): Nueva serie de extensión del hielo marino ártico en septiembre entre 1935 y 2014. Rev. Climatol., 16: 1-19.
https://diablobanquisa.wordpress.com/2016/01/14/new-time-series-september-arctic-sea-ice-extent-1935-2014/
https://diablobanquisa.wordpress.com/2016/01/14/extension-hielo-marino-artico-1935-2014/
http://neven1.typepad.com/blog/2016/01/september-arctic-sea-ice-extent-1935-2014.html
--------------------------
Cited by
Connolly, R., Connolly, M., & Soon, W. (2017). Re-calibration of Arctic sea ice extent datasets using Arctic surface air temperature records. Hydrological Sciences Journal.
http://www.tandfonline.com/doi/abs/10.1080/02626667.2017.1324974
Cited by:
MUELLER, Bennit L., et al. Attribution of Arctic Sea Ice Decline from 1953 to 2012 to Influences from Natural, Greenhouse Gas, and Anthropogenic Aerosol Forcing. Journal of Climate, 2018, vol. 31, no 19, p. 7771-7787.
https://doi.org/10.1175/JCLI-D-17-0552.1
-------------------------------------------------------------------------------------


No hay comentarios:
Publicar un comentario